Sampling cuts attention error in long-context model tests
At equal numbers of lookup entries read, 90th-percentile attention error was 4.6–7.9 times lower than the best of 15 baseline families.
Edited by Boris Djordjevic · Paperfoot
The researchers developed certified sparse attention via perturbed retrieval, tested on three large language models in ten settings spanning 16,000–128,000 tokens. The method samples stored values to estimate attention, which weights information during text generation. It checks confidence bounds on attention-output error. With fresh randomness at each generation step, each certificate fails with probability at most a specified limit. No certificate was violated in the tests.
At equal lookup entries read, its 90th-percentile error was 4.6–7.9 times lower than the best of 15 baseline families. At equal bytes, the best baselines had 0.6–1.6 times its 90th-percentile error and at least 4.9 times its largest error. On a central processing unit at 32,000–128,000 tokens, decoding ran 1.1–1.4 times faster than dense attention, which uses all stored values, on the same 16-bit cache.
Why it matters
The method provides a stopping rule for reading stored values, tied to a target attention error and a limited probability of certificate failure. Tests on three language models found no certificate violations, but the protection remains probabilistic.
Caveats
The candidate scan still reads every key—the lookup entries for stored values—and the strongest baselines matched its end-to-end task scores at equal bytes. Speedups were measured on a central processing unit; the paper is a preprint, not yet peer-reviewed.
From the paper
- Limitation
The slack of the certificates (Section 6.3) comes from the union bound over levels and events, the range term set by the largest value norm, and the upper bound on the spread of the light values.
Quoted word for word from the full text on arXiv.
In this paper
certified sparse attention
- Methods
- certified sparse attention (this paper)sink + local (baseline)oracle top-k (baseline)top-p (baseline)uniform sampling (baseline)Quest (baseline)PQCache (baseline)SOCKET (baseline)MagicPIG (baseline)HashAttention (baseline)vAttention (baseline)RetroInfer (baseline)
- Datasets
- LongBench (evaluated)RULER (evaluated)LongBench-v2 (evaluated)PG-19 (evaluated)
Results
- certified sparse attention, 90th-percentile error, \varepsilon=0.1, matched number of keys read: 0.010–0.012; certified sparse attention, maximum error, \varepsilon=0.1, matched number of keys read: at most 0.029
Our 90th-percentile error is 0.010–0.012 and our maximum at most 0.029, whereas the best baseline’s 90th percentile is 4.6–7.9 times higher (0.051–0.090), with maxima of 0.39–1.62 (Figures 2 and 3).
6.2 Error at a matched number of keys read
- certified sparse attention, largest error, value scale, observed errors: 0.31\varepsilon; certified sparse attention, largest error, output norm, observed errors: 0.41\varepsilon
The certificates are conservative: observed errors are about \varepsilon/10 at the 90th percentile, and the largest is 0.31\varepsilon for the value scale and 0.41\varepsilon for the output norm (Figure 3c).
6.3 Validity, measures and context length
- certified sparse attention, decoding step speedup, 32K–128K tokens on CPU: 1.1–1.4× faster
On CPU, decoding steps at 32K–128K tokens run 1.1–1.4× faster than dense attention on the same 16-bit cache.
Abstract
- certified sparse attention, change in perplexity, on PG-19, five settings, last 512 tokens scored with teacher forcing: - 0.02% to +0.07%; certified sparse attention, KL divergence from dense attention, on PG-19, five settings, last 512 tokens scored with teacher forcing: 0.0002–0.0006
Our method changes perplexity by - 0.02% to +0.07% in all five settings, and its KL divergence from dense attention’s next-token distribution is 0.0002–0.0006 (Table D.12).
6.4 End-to-end tasks and perplexity
- certified sparse attention, common-words extraction score, on RULER, reading as many keys as our method at every layer, step and query head on Llama at 32K: 25.2; certified sparse attention, common-words extraction score, on RULER, reading as many keys as our method at every layer, step and query head on Qwen3 at 32K: 86.0; certified sparse attention, common-words extraction score, on RULER, reading as many keys as our method at every layer, step and query head on Qwen2.5 at 32K: 74.4
Reading as many keys as our method at every layer, step and query head, oracle top- k drops from 27.8, 86.0 and 74.8 points to 12.0, 44.4 and 34.4 on Llama, Qwen3 and Qwen2.5, whereas our method scores 25.2, 86.0 and 74.4 (Table D.9c).
6.4 End-to-end tasks and perplexity
- certified sparse attention, keys read, on RULER, \varepsilon=0.1 on Llama at 32K: 443 keys; certified sparse attention, keys read, on RULER, \varepsilon=0.1 on Llama at 128K: 601
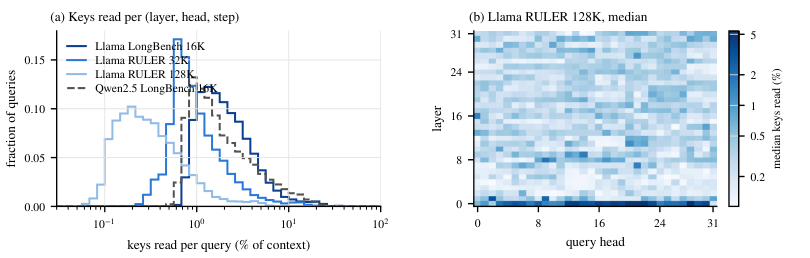
On Llama RULER at \varepsilon=0.1, our method reads 443 keys at 32K, 458 at 64K and 601 at 128K (Table D.4, Figure D.6a).
6.3 Validity, measures and context length
What it shows
- Perturbing key scores with independent exponential variables turns threshold retrieval into probability proportional to attention weight sampling, enabling unbiased Horvitz–Thompson estimation and simultaneous confidence bounds over nested samples.
We show that perturbing the score of every key with an independent Exp(1) variable turns threshold retrieval into sampling keys with probability proportional to their attention weights.
Abstract
- At a suitable threshold, the Horvitz–Thompson estimator reads O(ε−2log(1/δ)) values regardless of context length, which matches the lower bound up to constant factors.
At a suitable threshold, the estimator reads O(ε−2log(1/δ)) values regardless of the context length, and no adaptive method reads fewer, up to constants.
Abstract
- Across 120 evaluated configurations spanning 10 settings, three measures, and four error targets, no observed error exceeded the target error ε and no head required fallback.
Across 120 configurations (10 settings × 3 measures × 4 values of \varepsilon ), no (layer, head, step) error exceeds \varepsilon, no single layer has a violation, and no head falls back to exact attention.
6.3 Validity, measures and context length
- End-to-end task scores remain within one point of dense attention while 79–98% of generation outputs are identical to dense attention outputs.
Mean scores stay within one point of dense attention, and 79–98% of the outputs are identical to dense attention’s (Table 2).
6.4 End-to-end tasks and perplexity
- The 4-bit key candidate generation scan moves a fixed 16.4% of dense attention bytes, imposing a floor on bandwidth savings that limits speedup.
The 4-bit scan moves a fixed 16.4% of the bytes of dense attention.
7 Limitations and Discussion
Quoted word for word from the full text on arXiv.
The paper
Certified Sparse Attention via Perturbed Retrieval
arXiv, Oct 18, 2026, Open access, Preprint, not peer-reviewed
doi.org/10.48550/arxiv.2610.24991
arXiv:2610.24991v1 in cs.LG, also cs.CL
Comments: 58 pages (10 pages main text, 48 pages appendix), 10 figures, 35 tables
Cite as BibTeX
@misc{li2026certified,
  title = {Certified Sparse Attention via Perturbed Retrieval},
  author = {Li, Runguo},
  year = {2026},
  eprint = {2610.24991},
  archivePrefix = {arXiv},
  primaryClass = {cs.LG},
  doi = {10.48550/arxiv.2610.24991},
  url = {https://arxiv.org/abs/2610.24991}
}